AMERICA’S CARBON ADVANTAGE
U.S. manufacturers across industries are highly carbon efficient compared to most of their key trading partners. As a result, America makes goods with fewer emissions than most countries in the world. We call this a carbon advantage.
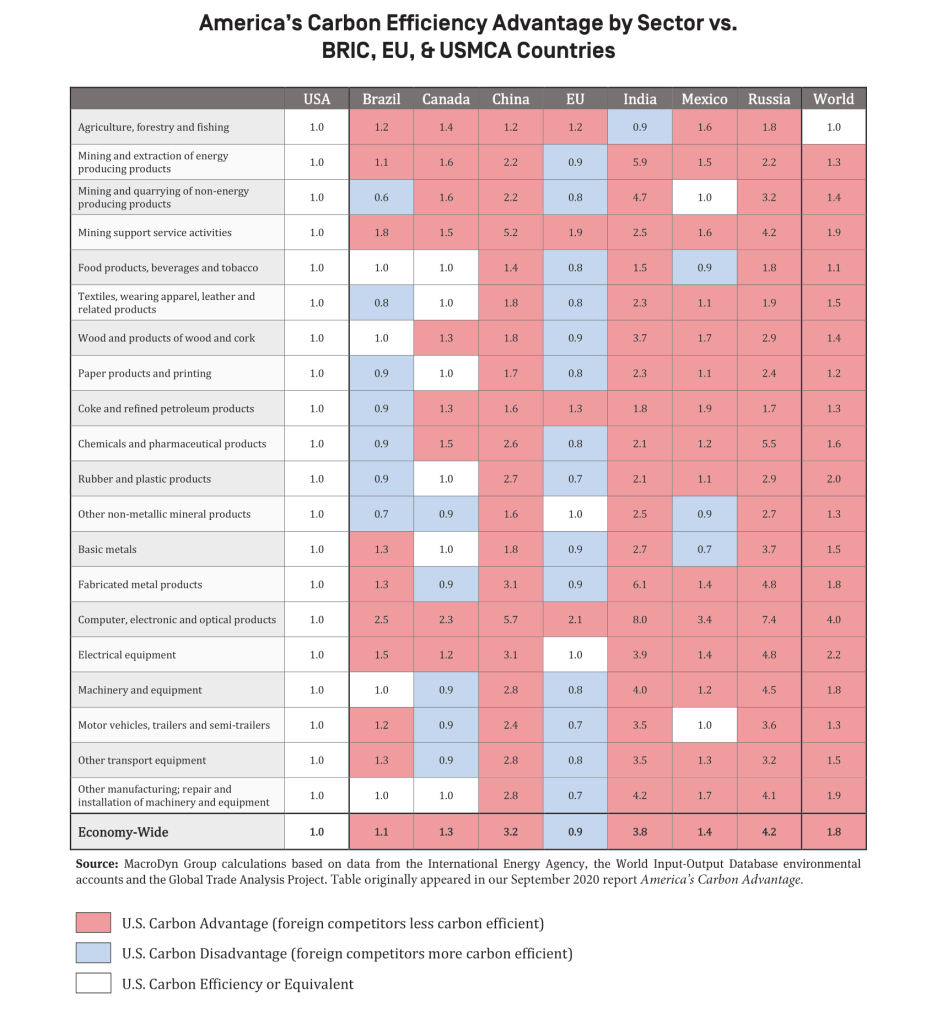
The Council commissioned a model that follows the carbon embedded in global trade and calculates the emissions from 36 highly aggregated economic sectors across 64 individual countries. Weighted by economic output, the model reveals the relative carbon efficiency of production, by sector, across countries.
The table above provides a summary of the analysis and compares the U.S. carbon advantage to some of our most significant trading partners. To make inter-country comparisons more straightforward, the Council weights embodied emissions associated with economic output from each sector and country relative to the carbon intensity of U.S. output in the sector (U.S. = 1.0). If a number is larger than 1.0, it reflects that a country or sector is less carbon-efficient and that the U.S. has a carbon advantage; if the number is below 1.0, it reflects a country or sector that is more carbon-efficient than the U.S.
This table originally appeared in the Council’s 2020 report, America’s Carbon Advantage.

In 2020, the Council released a first-of-its-kind study that underscored America’s striking carbon efficiency advantage over its key trading partners. By leading and establishing a new order on climate and trade, America can leverage this significant carbon advantage to enhance the competitiveness of U.S. businesses, bring manufacturing jobs back to the U.S., and boost climate ambition around the world.
THE U.S. CARBON ADVANTAGE IN STEEL
The Climate Leadership Council commissioned CRU International Ltd., a global commodity markets intelligence firm, to study the carbon intensity of the U.S. steel industry. It found that the U.S. steel industry is 75% – 320% more carbon efficient than global producers, depending on the product segment.
In light of the U.S.-EU Global Arrangement on Sustainable Steel and Aluminum, a subsequent study conducted by CRU in 2022 simulated the impact of carbon intensity import fees on the U.S. and European domestic markets as well as on nonmarket economies. Because of our carbon advantage, U.S. industry came out well-ahead ahead in simulations.
THE U.S. CARBON ADVANTAGE IN CHEMICALS
The United States chemicals manufacturing industry has a distinct carbon efficiency advantage compared to other major producing countries. This conclusion is supported by the Council’s analysis of five major bulk chemicals that are manufactured using a variety of production methods and feedstock inputs. With incentives in place to reward carbon efficiency in traded goods, U.S. chemical producers can leverage their carbon advantage to lower global emissions and improve their competitive position in the global marketplace.
THE U.S. CARBON ADVANTAGE IN SOLAR
The U.S. carbon advantage is also evident in decarbonization technologies like solar energy. Today, the U.S. is a small player in solar – but it holds a distinct carbon-efficiency advantage in that sector. China, which dominates the global solar market, emits twice as much as the U.S. when manufacturing solar panels.
The U.S. carbon advantage is even more evident with its leadership in next-generation solar technology. Thin film solar panels, which make up 16% of the U.S. solar market, generate 90% less greenhouse gas emissions than the silicon-based modules in which China specializes.

THE U.S. CARBON ADVANTAGE IN ELECTRICITY
As the primary energy input for all carbon-intensive industry, electricity is the backbone of the global economy and the key to an economy-wide carbon advantage. Notably, electricity generation in the United States produces fewer emissions than most other major economies. The U.S. maintains this carbon advantage because it has a strong base of carbon-free nuclear power, led the transition from coal to gas, and has simultaneously expanded renewable energy capacity.
The U.S. is also a major exporter of the generators, transformers, convertors, and resistors that the world needs to build robust electricity infrastructure. The U.S. generates fewer emissions in the production of these technologies than most other major exporters. The U.S. can leverage this carbon advantage in the production of electrical equipment to enhance exports while advancing global decarbonization efforts.
OTHER RESOURCES
Since the publication of the Council’s 2020 report, America’s Carbon Advantage, subsequent studies have echoed our analysis and underscored America’s proficiency in carbon-efficient manufacturing across various sectors. Here are some other resources that corroborate our findings:
- The OECD’s Trade in Embodied CO2 (TeCO2) database offers comprehensive insights into CO2 emissions embodied in international trade and domestic final demand. This resource highlights patterns of CO2 demand versus production. You can find this resource here.
- A 2019 analysis by the National Energy Technology Laboratory affirms that U.S. liquefied natural gas exports for power production in European and Asian markets maintain a carbon advantage over regional alternatives. You can find this study here.
- A 2014 study from Northwestern University and the U.S. Department of Energy’s Argonne National Laboratory found that solar panels made in China have a larger carbon footprint and are likely to use substantially more energy during manufacturing than those made in Europe or the U.S. You can read this analysis here.
- A 2023 investigative article argues that solar panels’ carbon intensity could be three times higher than estimated by the UN’s Intergovernmental Panel on Climate Change due to a lack of accurate data from China, which dominates the global solar market. Learn more here.
- A 2019 report by the International Energy Agency highlights how the switch from coal to gas in the U.S. power sector has contributed to America’s carbon advantage in electricity generation. You can find this resource here.
- The UN’s FAOSTAT database contains food and agriculture data for over 245 countries and territories. Its emissions intensity data underscores that U.S. production of commodities like beef boasts a notably lower carbon intensity than other major exporters. You can find this database here.